Network monitoring means continuously watching devices and services so problems are seen before users notice them: a link that has dropped, a disk filling up, an overheating switch or a service that stops responding. There are many monitoring tools, each built for different circumstances. This article only compares the broad strokes, to make choosing easier.
What does a monitoring tool measure?
- Availability (ping): whether a device is up and answering.
- SNMP: bandwidth per port, CPU and memory use, temperature and power supply status of routers and switches.
- Services: whether the website, email, database or phone system is up.
- Traffic (NetFlow / sFlow): who and which application is using the bandwidth.
- Agents on servers: operating system, disk and service details on Windows and Linux.
The real value of any tool is timely alerting; a beautiful dashboard without proper alerts is just a picture.
A short introduction to the tools
PRTG Network Monitor
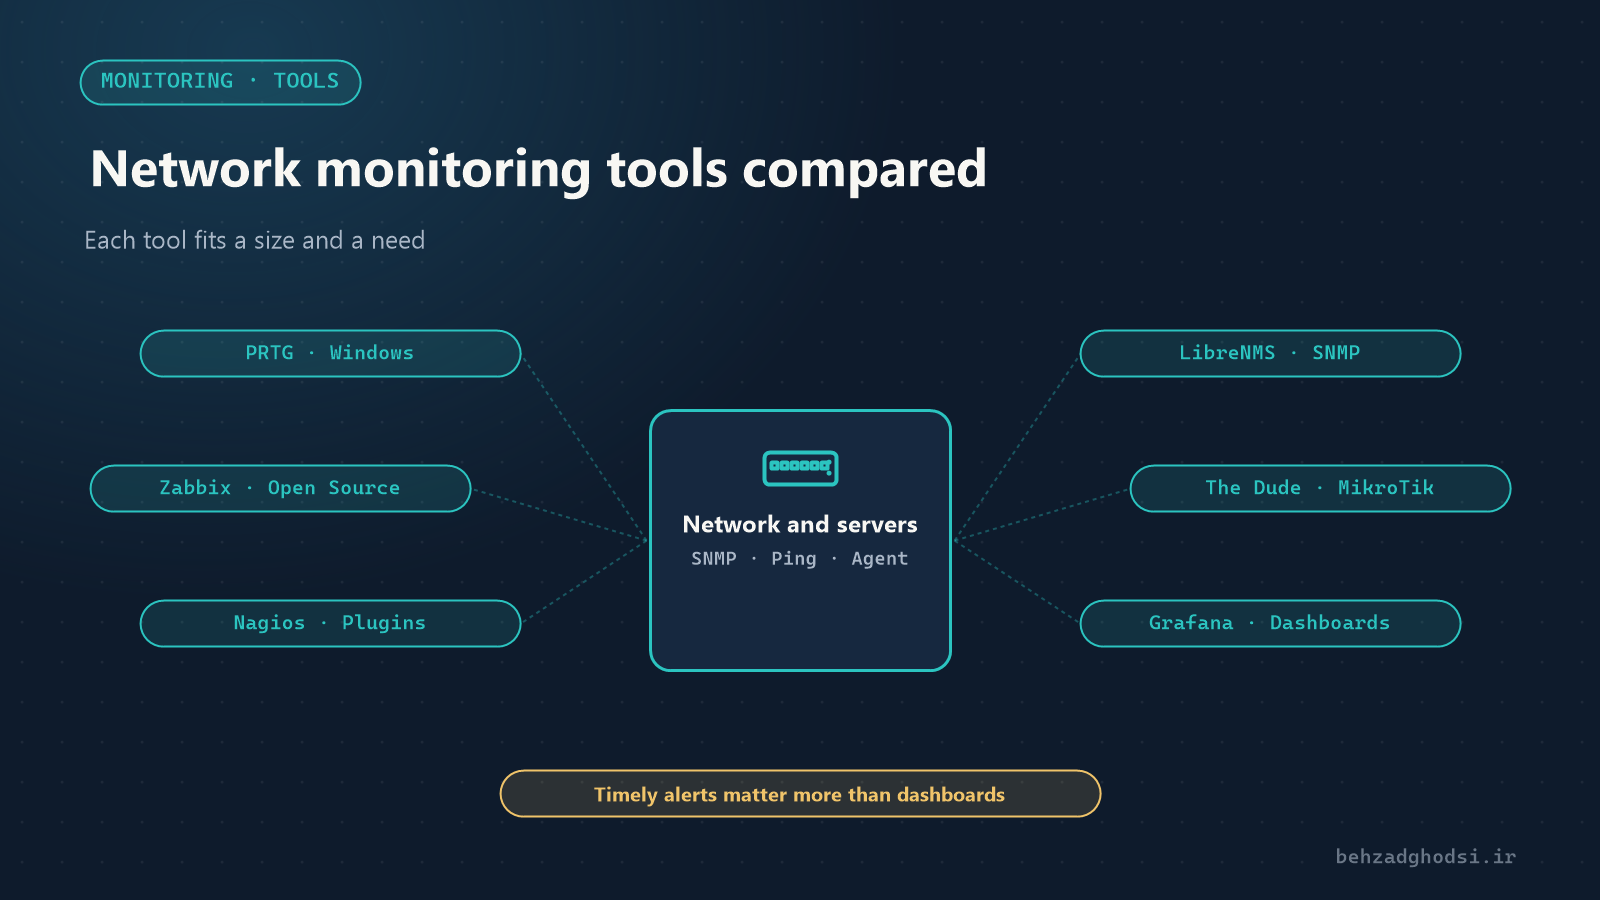
PRTG is a commercial product from Paessler that runs on Windows. It is the easiest to set up: it discovers devices automatically and has a ready-made sensor for everything. Licensing is by number of sensors, and up to 100 sensors are free. It is a common choice for small and medium organisations with a small IT team.
Zabbix
Zabbix is open source and free and runs on Linux. It supports both SNMP and agents well, has many ready-made templates and scales to thousands of devices. In return, it takes longer to learn and set up.
Nagios
Nagios is one of the oldest tools in this field. Nagios Core is free and works with configuration files and plugins; it is very flexible but has no simple user interface. The commercial Nagios XI has a fuller graphical interface.
LibreNMS
LibreNMS is open source and free and focuses on network devices. It discovers routers and switches automatically over SNMP, builds maps and port graphs, and supports many brands, including Cisco and MikroTik.
The Dude
The Dude is MikroTik’s free tool, running on RouterOS with a Windows client. It draws a network map and shows device status on it. For small and medium networks that are mostly MikroTik it is quick and inexpensive, but its reporting and features are more limited than the others.
Grafana and Prometheus
Grafana builds dashboards and Prometheus collects the data. This combination is used more for servers, containers and applications than for network devices. Grafana can also sit on top of Zabbix or Prometheus for more readable dashboards.
Side by side
- Cost: Zabbix, Nagios Core, LibreNMS and The Dude are free; PRTG and Nagios XI are licensed.
- Ease of set-up: PRTG and The Dude are the simplest; Zabbix and Nagios take more time.
- Network devices: LibreNMS and PRTG are strong; The Dude for MikroTik networks.
- Servers and services: Zabbix and Nagios are the most complete; Grafana for visualising data.
- Operating system: PRTG on Windows; the others mostly on Linux.
- Scale: Zabbix suits large, multi-site networks best.
Which one should you choose?
- Small or medium organisation with a small IT team: PRTG; it is up and running quickly and easy to maintain.
- Limited budget and a need to monitor both network and servers fully: Zabbix.
- A network full of switches and routers: LibreNMS, or The Dude if most of the equipment is MikroTik.
- A technical team that prefers manual configuration: Nagios Core.
Licensing costs and payment options also matter when comparing commercial and open-source tools; for many organisations they make the open-source options the more practical choice.
Practical tips
- Before installing, write down the list of critical devices and services; monitoring everything from day one only produces useless alerts.
- Enable SNMP with version 3, or at least with a non-default community restricted to the monitoring server’s address. On MikroTik this is also covered in Network security with MikroTik.
- Send alerts where they will actually be seen: email, SMS or a messaging app.
- Tune alert thresholds after a few weeks, based on how the network really behaves.
There is no “best” tool; the right one depends on the size of your network, your budget and your team. PRTG for simplicity, Zabbix for power at zero cost, LibreNMS for network devices and The Dude for MikroTik networks. See an example of centralised monitoring in the steel plant case study.